- Bitcoin cash started a decent increase above the $108 and $112 resistance levels against the US Dollar.
- The price is now trading above the $115 zone and the 55 simple moving average (4-hours).
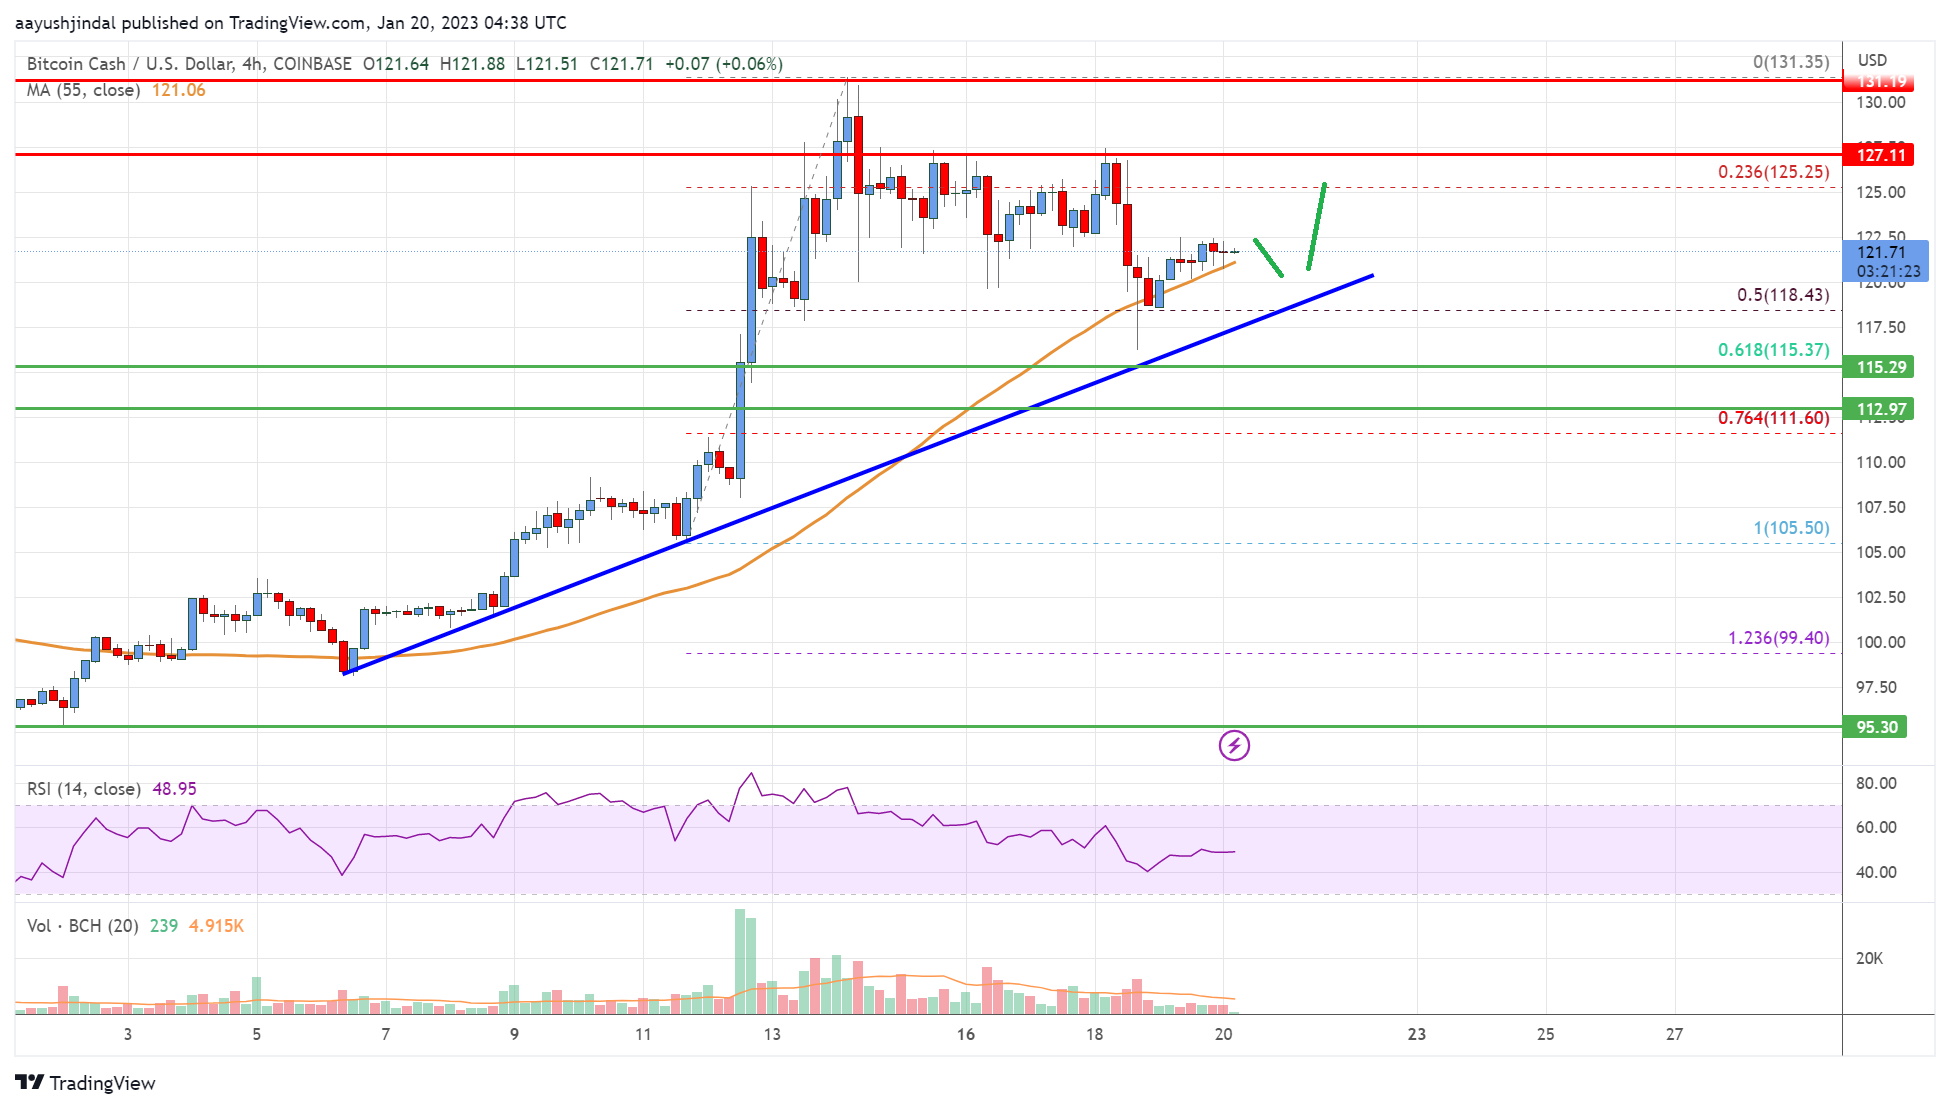
- There is a key bullish trend line forming with support near $118 on the 4-hours chart of the BCH/USD pair (data feed from Coinbase).
- The pair must clear $125 and $130 to continue higher in the near term.
Bitcoin cash price is climbing above $115 against the US Dollar, similar to bitcoin. BCH/USD could start a fresh surge if it clears the $130 level.
Bitcoin Cash Price Analysis
Bitcoin cash price formed a decent support base above the $110 level. BCH started a recovery wave and was able to clear the $112 resistance zone.
The price climbed above the $120 and $125 resistance levels. The pair is now trading above the $115 zone and the 55 simple moving average (4-hours). The recent surge was such that the price even traded above the $125 level. A high is formed near $132 before there was a minor decline.
There was a move below the 50% Fib retracement level of the upward move from the $106 swing low to $132 high. It is now trading above the $115 zone and the 55 simple moving average (4-hours).
On the upside, the price is facing resistance near the $125 level. The next major resistance is near the $132 level, above which the price may perhaps rise towards the $150 level. Any more gains above $150 could set the pace for a move towards the $165 level in the coming days.
An immediate support on the downside is near the $118 level. There is also a key bullish trend line forming with support near $118 on the 4-hours chart of the BCH/USD pair.
The first major support sits near the $115 level. It is near the 61.8% Fib retracement level of the upward move from the $106 swing low to $132 high. The next major support is near $105, below which the bears might aim $100. The next target for them may perhaps be near the $92 level.
Bitcoin Cash Price
Looking at the chart, bitcoin cash price is now trading above the $115 zone and the 55 simple moving average (4-hours). Overall, the price must clear $125 and $132 to continue higher in the near term.
Technical indicators
4 hours MACD – The MACD for BCH/USD is gaining pace in the bullish zone.
4 hours RSI (Relative Strength Index) – The RSI for BCH/USD is near the 50 level.
Key Support Levels – $118 and $115.
Key Resistance Levels – $125 and $132.
Tags: BCH, Bitcoin Cash
Bitcoin Cash Analysis: Dips Remain Attractive Near $115
Republished By Plato
Bitcoin cash price is climbing above $115 against the US Dollar, similar to bitcoin. BCH/USD could start a fresh surge if it clears the $130 level.
Bitcoin Cash Price Analysis
Bitcoin cash price formed a decent support base above the $110 level. BCH started a recovery wave and was able to clear the $112 resistance zone.
The price climbed above the $120 and $125 resistance levels. The pair is now trading above the $115 zone and the 55 simple moving average (4-hours). The recent surge was such that the price even traded above the $125 level. A high is formed near $132 before there was a minor decline.
There was a move below the 50% Fib retracement level of the upward move from the $106 swing low to $132 high. It is now trading above the $115 zone and the 55 simple moving average (4-hours).
On the upside, the price is facing resistance near the $125 level. The next major resistance is near the $132 level, above which the price may perhaps rise towards the $150 level. Any more gains above $150 could set the pace for a move towards the $165 level in the coming days.
An immediate support on the downside is near the $118 level. There is also a key bullish trend line forming with support near $118 on the 4-hours chart of the BCH/USD pair.
The first major support sits near the $115 level. It is near the 61.8% Fib retracement level of the upward move from the $106 swing low to $132 high. The next major support is near $105, below which the bears might aim $100. The next target for them may perhaps be near the $92 level.
Bitcoin Cash Price
Looking at the chart, bitcoin cash price is now trading above the $115 zone and the 55 simple moving average (4-hours). Overall, the price must clear $125 and $132 to continue higher in the near term.
Technical indicators
4 hours MACD – The MACD for BCH/USD is gaining pace in the bullish zone.
4 hours RSI (Relative Strength Index) – The RSI for BCH/USD is near the 50 level.
Key Support Levels – $118 and $115.
Key Resistance Levels – $125 and $132.
Tags: BCH, Bitcoin Cash
Australia Sanctions LockBit Honcho to Cut Off Cash
IBM brings Power 10 servers to bear on AI edge deployments
Finavia achieves net zero carbon emissions at four airports, earns sustainable travel certificates
Ryanair urges EU citizens to vote in EU elections, emphasising benefits of low-fare air travel
F/A-18E Super Hornets Carrying 9 Air-to-Air Missiles To Counter Houthi Drones In Red Sea
AI Can Now Generate Entire Songs on Demand. What Does This Mean for Music as We Know It?
12 AI Courses Per Your Current Requirement and Experience in 2024
British Self-Driving Car Maker Wayve Revs Up With Whopping $1B SoftBank-led Round
Leasing vs buying a car | Which is better for you? – Autoblog