- Bitcoin cash started a decent increase above the $108 and $112 resistance levels against the US Dollar.
- The price is now trading above the $115 zone and the 55 simple moving average (4-hours).
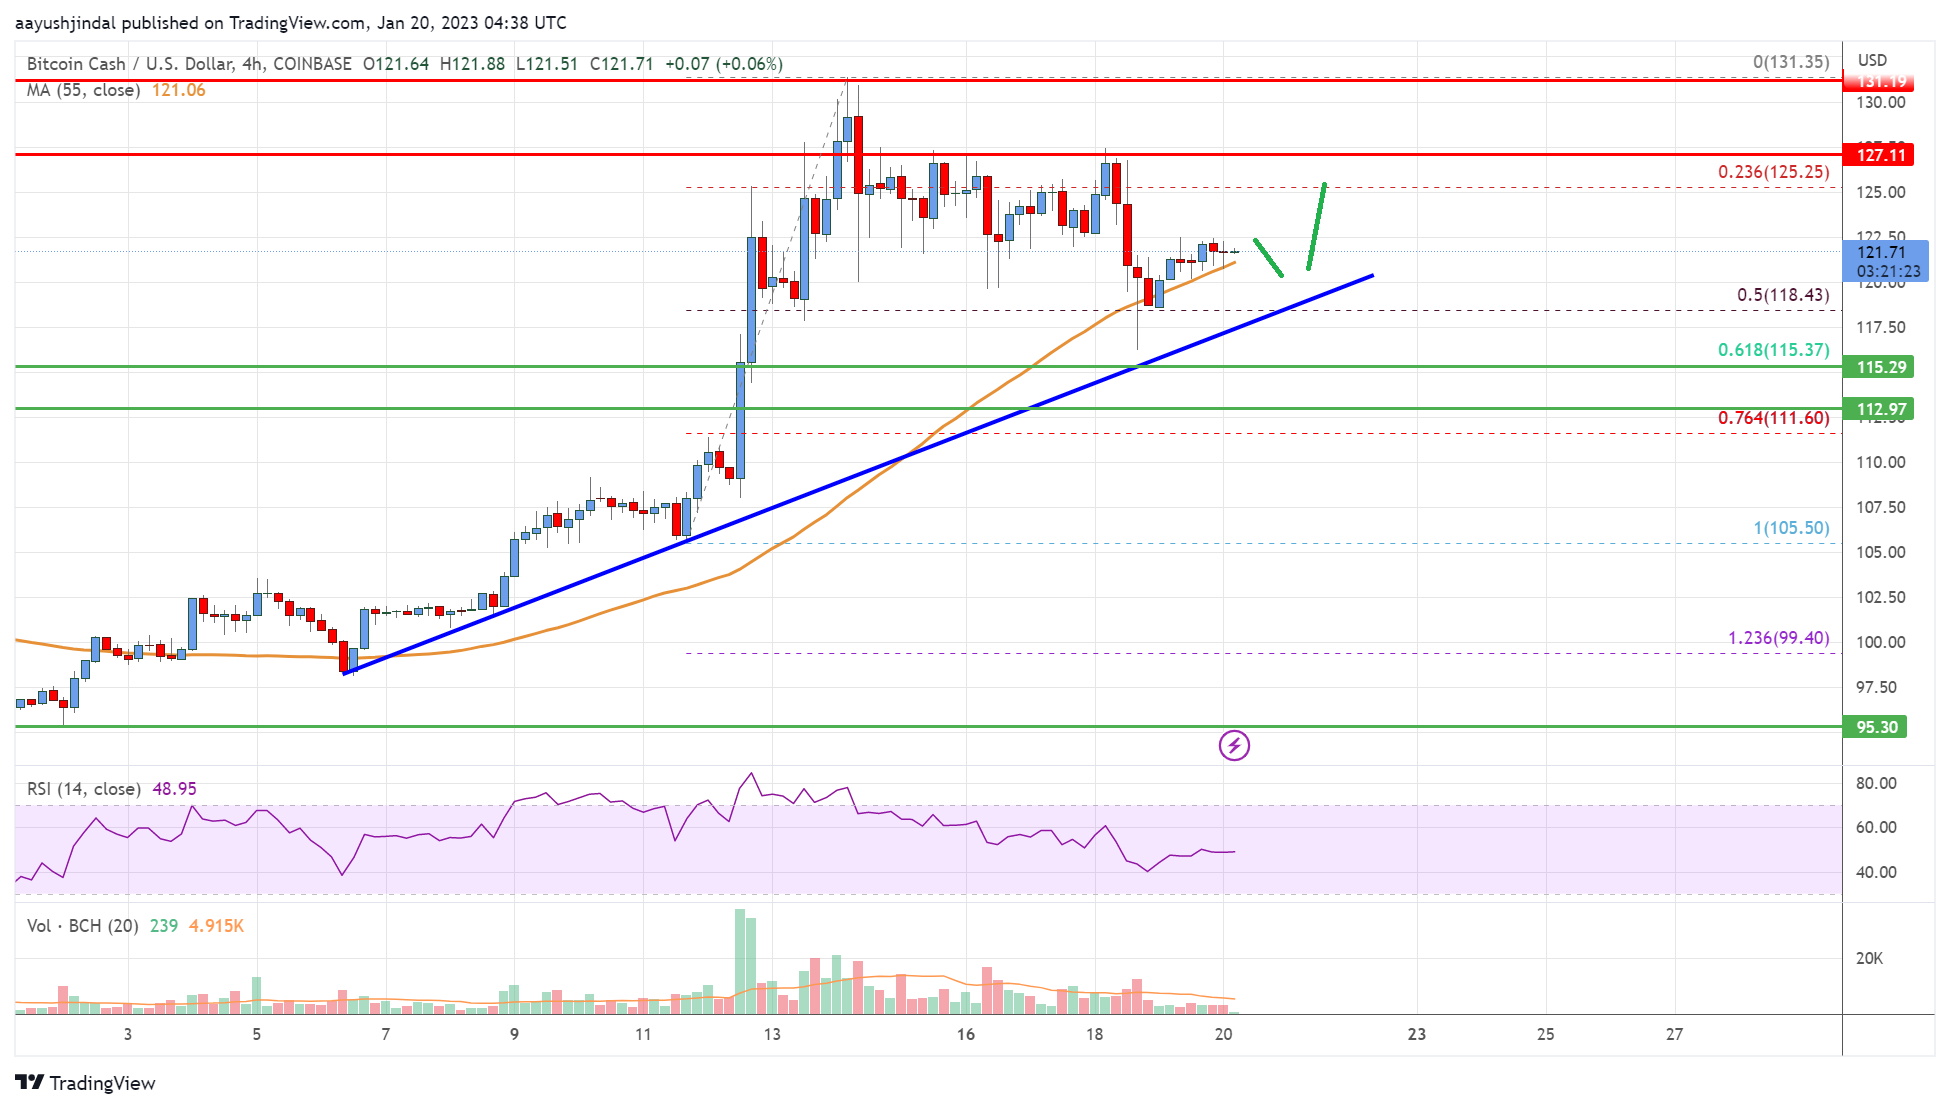
- There is a key bullish trend line forming with support near $118 on the 4-hours chart of the BCH/USD pair (data feed from Coinbase).
- The pair must clear $125 and $130 to continue higher in the near term.
Bitcoin cash price is climbing above $115 against the US Dollar, similar to bitcoin. BCH/USD could start a fresh surge if it clears the $130 level.
Bitcoin Cash Price Analysis
Bitcoin cash price formed a decent support base above the $110 level. BCH started a recovery wave and was able to clear the $112 resistance zone.
The price climbed above the $120 and $125 resistance levels. The pair is now trading above the $115 zone and the 55 simple moving average (4-hours). The recent surge was such that the price even traded above the $125 level. A high is formed near $132 before there was a minor decline.
There was a move below the 50% Fib retracement level of the upward move from the $106 swing low to $132 high. It is now trading above the $115 zone and the 55 simple moving average (4-hours).
On the upside, the price is facing resistance near the $125 level. The next major resistance is near the $132 level, above which the price may perhaps rise towards the $150 level. Any more gains above $150 could set the pace for a move towards the $165 level in the coming days.
An immediate support on the downside is near the $118 level. There is also a key bullish trend line forming with support near $118 on the 4-hours chart of the BCH/USD pair.
The first major support sits near the $115 level. It is near the 61.8% Fib retracement level of the upward move from the $106 swing low to $132 high. The next major support is near $105, below which the bears might aim $100. The next target for them may perhaps be near the $92 level.
Bitcoin Cash Price
Looking at the chart, bitcoin cash price is now trading above the $115 zone and the 55 simple moving average (4-hours). Overall, the price must clear $125 and $132 to continue higher in the near term.
Technical indicators
4 hours MACD – The MACD for BCH/USD is gaining pace in the bullish zone.
4 hours RSI (Relative Strength Index) – The RSI for BCH/USD is near the 50 level.
Key Support Levels – $118 and $115.
Key Resistance Levels – $125 and $132.
Tags: BCH, Bitcoin Cash
Bitcoin Cash Analysis: Dips Remain Attractive Near $115
Republished By Plato
Bitcoin cash price is climbing above $115 against the US Dollar, similar to bitcoin. BCH/USD could start a fresh surge if it clears the $130 level.
Bitcoin Cash Price Analysis
Bitcoin cash price formed a decent support base above the $110 level. BCH started a recovery wave and was able to clear the $112 resistance zone.
The price climbed above the $120 and $125 resistance levels. The pair is now trading above the $115 zone and the 55 simple moving average (4-hours). The recent surge was such that the price even traded above the $125 level. A high is formed near $132 before there was a minor decline.
There was a move below the 50% Fib retracement level of the upward move from the $106 swing low to $132 high. It is now trading above the $115 zone and the 55 simple moving average (4-hours).
On the upside, the price is facing resistance near the $125 level. The next major resistance is near the $132 level, above which the price may perhaps rise towards the $150 level. Any more gains above $150 could set the pace for a move towards the $165 level in the coming days.
An immediate support on the downside is near the $118 level. There is also a key bullish trend line forming with support near $118 on the 4-hours chart of the BCH/USD pair.
The first major support sits near the $115 level. It is near the 61.8% Fib retracement level of the upward move from the $106 swing low to $132 high. The next major support is near $105, below which the bears might aim $100. The next target for them may perhaps be near the $92 level.
Bitcoin Cash Price
Looking at the chart, bitcoin cash price is now trading above the $115 zone and the 55 simple moving average (4-hours). Overall, the price must clear $125 and $132 to continue higher in the near term.
Technical indicators
4 hours MACD – The MACD for BCH/USD is gaining pace in the bullish zone.
4 hours RSI (Relative Strength Index) – The RSI for BCH/USD is near the 50 level.
Key Support Levels – $118 and $115.
Key Resistance Levels – $125 and $132.
Tags: BCH, Bitcoin Cash
The Week’s 10 Biggest Funding Rounds: Xaira And Other AI Startups Have Huge Week
EV Range Anxiety: It Really Is All In Your Mind – CleanTechnica
Redwood Materials Has Good News About Electric Cars – CleanTechnica
Weekly funding round-up! All of the European startup funding rounds we tracked this week (April 22 – April 26) | EU-Startups
EU Commission Backs Germany’s Renewable Hydrogen Plan with $380M Funding
Meta AR Glasses Lead Claims They’re As Mindblowing As Original Rift
‘EA Sports WRC’ Gets PC VR Support Next Week Following Season 4 Launch
Minimum Viable Compliance: What You Should Care About and Why